Using big open data, Time.com has produced and published “How Safe Am I From a Natural Disaster” in which it presented a “disaster index” for each county in the United States based on National Weather Service (NWS) and National Oceanic and Atmospheric Administration (NOAA) data. While the idea is exciting, the resulting piece doesn’t recognize the flaws in the source data and compounds those flaws by making some mistakes of their own in the process.
Issues with this interactive map and dataset are best illustrated by examining Time.com’s data for Orleans Parish, Louisiana (LA), which gets you the table below *:
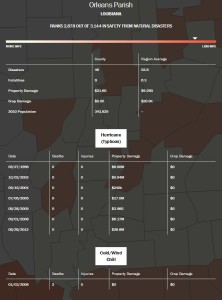
New Orleans – Orleans Parish Natural Disaster Data Detail From Time.com Retrieved 10:30 am EST August 29, 2014
Choosing Orleans Parish (parishes are Louisiana’s equivalent of counties) for comparison is intentional, given that over 1,500 people died during Hurricane Katrina in 2005, most of them residents of New Orleans, which shares the same boundary as Orleans Parish. In addition to being one of the five deadliest hurricanes in history, Hurricane Katrina was the costliest ever natural disaster in the United States causing over $100 billion of damage.
Yet Orleans Parish does not appear on Time.com’s top ten list of “Most Dangerous Counties”, with Time.com ranking it as the 266th most dangerous county in the United States while ranking Ocean County, NJ the 1st most dangerous in the nation. Ocean County’s most dangerous ranking is assigned in spite of the highest number of confirmed deaths from a single event over the last 65 years was 37 dead from Hurricane Sandy in 2012 (btw, those deaths are not found this Time.com project), with few other deaths beyond those. Furthermore, Time.com indicates only property damage on August 28, 2005 and nothing for subsequent days after Hurricane Katrina.
To figure out why this seemingly inexplicable result exists, let’s start by identifying the source data from which the mapping and analysis was generated. Time.com claims that “The disaster index is calculated from all records in the National Oceanic and Atmospheric Administration storm events database, which includes earthquakes and tornados [sic] from 1950 and 42 other event types since 1996.” Here is a summary of NOAA source descriptions:
- National Weather Service (NWS) Storm Prediction Center which includes Tornadoes (1950-1992), Thunderstorm Winds (1955-1992) and Hail (1955-1992)
- National Weather Service (NWS) Weather Offices keyed Storm Data files sent to National Climatic Data Center (NCDC) in Word Perfect 5.0 format on 3.5″ floppy diskettes and imported into more unified data files. They note that “These data had many inconsistencies in the spelling of event types and were standardized into the 48 current event types at NCDC in 2013.”
- National Weather Service (NWS) Paradox Database Files: I can’t do any better job describing how dirty the data was than letting NOAA’s description speak for itself; “Beginning in January 1996, the NWS began using Storm Data for forecast verification purposes and the NWS decided to collect the data at the NWS Headquarters in Silver Spring, MD. They selected Borland/Corel Paradox format for their database and supplied the NCDC with the raw data files, which were then used for the Storm Data publication and inclusion into the Storm Events Database. From 1996-1999, the event type field was a free-text field so there were many, many variations of event types. Most of the events were standardized into the 48 current event types in 2013. In 2000 the NWS added a drop-down selector for Event Type on the data entry interface, which standardized the Event Type values sent to NCDC.”
- National Weather Service (NWS) Windows SQL Server Database Exported Comma-Separated Text (CSV) Files: Beginning in October 2006, the NWS supplied NCDC a comma separated (CSV) text files that NCDC import into its own database for the Storm Data publication and Storm Events Database.
Time.com’s first failure was not to prominently note NOAA’s own overt recognition of messy data, data often collected and recorded without rigorous field specifications and definitions. While the NOAA data descriptions note that the NWS and NOAA cleaned them up somewhat, the data remains messy.
Delving into how messy this data gets us answers on the faulty specifics. In the Time.com Orleans Parish data table produced by the Time.com Safest Counties tool (shown above in “New Orleans – Orleans Parish Natural Disaster Data Detail”), property damage is listed as only on August 28, 2005, with no deaths at all *** and only direct costs for August 28th and 29th, in spite of over 50 levees breaching causing billions of dollars worth of flood damage and hundreds of deaths.
Pulling New Orleans storm event data directly from the National Weather Service’s Storm Events Database, Table 1: Hurricane Katrina Late August NWS – NOAA Storm Events Entries (abbreviated) contains two faulty entries of interest:
Table 1: Hurricane Katrina Late August NWS – NOAA Storm Events Entries (abbreviated)
| EVENT_ID |
CZ_NAME_STR |
BEGIN_LOCATION |
BEGIN_TIME |
DEATHS_DIRECT |
DAMAGE_PROPERTY_NUM |
| 5475622 |
ORLEANS (ZONE) |
8/28/2005 |
Hurricane (Typhoon) |
0 |
3,560,000,000 |
| 5475650 |
ORLEANS (ZONE) |
8/29/2005 |
Storm Surge/Tide |
0 |
17,900,000,000 |
It is now clear why Time.com reported no deaths; the lack of deaths was in the Weather Service’s database! ***
The next mistake was Time.com’s and perhaps the more significant one; exclusively using the number of claims as opposed to deaths, damages, crop damage or a weighted assessment of multiple criteria. Using this single, significantly flawed database compounded the problem and led to very problematic conclusions.
There are a few lessons for data analysts and data team journalists:
- Test your own tool alongside real world facts and make sure the stories they tell are similar.
- Go back to the original data and compare multiple records from that source to your final product. Choose high and low outliers AND additional random cases to insure processing and display accuracy.
- Before going live / public, have someone inside AND outside your organization review your final product. Familiarity breeds blindness.
And really, any readers of journalism that contains data from large data sets should cast a critical eye on the source and quality of data.
Big-data driven, computer-assisted reporting is here to stay, and that is as it should be. We can discover new truths about our world through the analysis of data which in many cases has existed for decades. That data was just waiting for the tools, computing power and new-found excitement for vigorous and efficient science, business, and government. While the problems revealed by this study can be minimized by good data practice, they won’t be eliminated and we should accept that. After all, in this budget-pinched, high-speed news world, the answer to the question “Would you rather something be reported and corrected, or not be reported at all?” should almost certainly be to accept the former and fight the later.
Data driven journalism requires the same level of reader awareness and skepticism as does traditional journalism, and perhaps even a bit more data checking. “Don’t believe everything you read” doesn’t magically go away once a map, chart or table of numbers appears, be it in your local newspaper or on the Internet.
* Update November 24, 2014 – In addition to a few small corrections made in the body of the article, what follows is a clarification Time.com’s project title. Though the title of the piece at the top of their interactive map website is “How Safe am I From a Natural Disaster”, the page title for the piece embedded in the page’s code but not displayed directly on the page is the “Most Dangerous Place to Live in America: Natural Disasters”. The feature’s URL of http://time.com/safest-counties/ and “How Safe am I…” title do suggest that they intended to indicate lower numbered counties as “safer” and higher numbered counties as more “dangerous”.
This piece is part of Time.com’s bigger project called “Time, The Answers Issue“, the subtitle of which is “Everything You Never Knew You Needed to Know”. Two final notes. I am not sure anymore whether to call the organization “Time Magazine”, “Time.com” or just “Time” given that while there ARE still print issues, much or all content is also available online (and more?). While Time, Inc. still refers to regularly released collections of articles as “issues”, it isn’t always clear if these collections are “magazines” anymore given the interactive features they contain and the fact that they may have no physical analog. And just for fun, the title of the piece at “The Answers Issue” portal uses yet another title variant and weblink; “How Safe Are You From a Natural Disaster?”
*** Update January 15, 2016 – NOAA has updated and corrected the database which now indicates 638 deaths for August 28, 2005 in Orleans Parish. I am not sure how long it took to NOAA to fix the Katrina entry since my original August 2014 publication date, but even if they fixed it immediately that meant that their entry was wrong for ten years prior to this post’s publication.